From Paper to Data: How to Build a Company That Decides by the Numbers
Most companies have more data than they think, yet decide on gut feeling. A four-step ladder that takes your company from manual reports to data-driven decisions.
In an ordinary management meeting, a simple question comes up: "Which of our products was the most profitable this quarter?" A long journey begins: a request to accounting, a file from sales, a manual merge in a spreadsheet, and a number that arrives a week later — which not everyone agrees on. This scene repeats in many companies even though they already have the data; it is just scattered, and nobody trusts it.
A data-driven company is not one that owns advanced analytics tools, but one where important questions are answered quickly, with a number everyone trusts.
The data maturity ladder
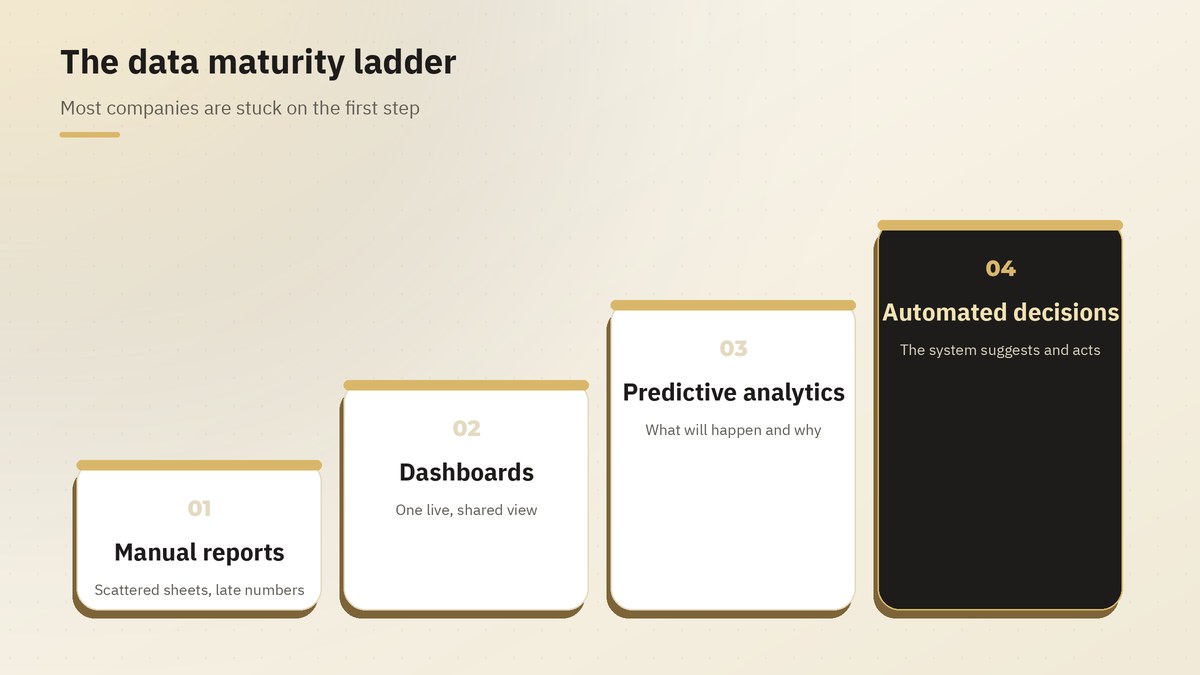
You cannot jump to the fourth step; each step builds on the quality of the one before.
Step one: manual reports
Data sits in separate systems and personal spreadsheets, and reports are prepared by hand and arrive late. Most companies stand here. The problem is not only the delay, but that every report may use a different definition of the same number.
Step two: dashboards
A single source of data, agreed definitions, and a live dashboard every manager sees without asking for it. This step alone changes the nature of meetings: the discussion moves from "which number is right?" to "what do we do about this number?".
Step three: predictive analytics
Once clean data accumulates, you can move from describing what happened to predicting what will happen: which customers are likely to leave? What demand should we expect next month? Where will stock run short? This is where AI models start to add real value.
Step four: automated decisions
For repeated decisions with clear rules, the system suggests the action or executes it directly: reordering stock, adjusting prices within set limits, routing requests to the right team. People remain responsible for the rules and the exceptions.
Start with questions, not tools
The most common mistake is buying an analytics tool and then looking for something to show in it. The right path is the reverse:
- Write down the ten most important questions management needs answered every week.
- Define the metric that answers each one, precisely: how is it calculated, from which source, and who owns it?
- Build one dashboard showing only those metrics, without clutter.
- Make it the centre of the weekly meeting — a dashboard that is not used in decisions dies quickly.
Metrics worth tracking in most companies
- Revenue and margin by product, customer and channel.
- Customer acquisition cost compared with lifetime value.
- Customer retention and the reasons customers leave.
- The cash conversion cycle: when do we pay, and when do we collect?
- Cycle time of core processes such as fulfilling an order or responding to a customer.
Data does not make decisions; people do. The role of data is to make good decisions easier and bad decisions harder to justify.
Common mistakes
- Measuring everything: dozens of metrics means nothing matters. Choose the few that drive decisions.
- Neglecting data quality: a beautiful dashboard on wrong data is more dangerous than no dashboard.
- Locking data inside one department: when only IT holds the keys, every question becomes a ticket waiting in a queue.
- Ignoring privacy: customer data is a trust, and handling it must comply with the data protection laws of every country you operate in.
Conclusion
Moving from paper to data is a gradual journey that starts with clear questions and shared definitions, then one dashboard that is actually used. A company that climbs this ladder step by step gains a quiet but decisive advantage: it learns faster than its competitors and fixes its mistakes before they become expensive.